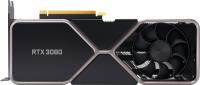
NVIDIA GeForce RTX 3080 - 10GB vs. NVIDIA GeForce RTX 5070 Ti - 16GB
In diesem Vergleich von NVIDIA GeForce RTX 3080 - 10GB versus NVIDIA GeForce RTX 5070 Ti - 16GB vergleichen wir die technischen Daten der beiden GPUs. Welche Grafikkarte ist schneller? Hier gibt es FPS & Benchmarks in Gaming und Anwendungen. Außerdem Daten zu Verbrauch, Effizienz (FPS pro Watt) und Preis-Leistung (FPS pro Euro).
Hinweis: Unsere Links sind Affiliate Links. Wir erhalten beim Kauf eine kleine Provision, ohne dass sich euer Preis erhöht.
Allgemeine Informationen
| Günstigster Preis |  ab 1.119,00€ ab 1.119,00€ | ab 1.166,22€ |
| Geizhals Bewertung | 5/5 aus 3 Bewertungen | 5/5 aus 7 Bewertungen |
| Serie | – | NVIDIA GeForce RTX 5070 Ti |
| Chip-Architektur | – | 70SM (8960SP/280TMU/96ROP), 70 RT-Cores, 280 Tensor-Cores, 48MiB L2-Cache |
| Chip-Bezeichnung | – | GB203 (GB203-300-A1) |
| Fertigung | – | TSMC N5P [NVIDIA 4N] |
| Chip-Größe | – | 378mm², monolithisch, 45.6 Mrd. Transistoren |
Performance Ranking
Das Performance-Ranking ermöglicht den schnellen Vergleich von zwei GPUs und gibt die durchschnittliche Leistung in den von uns getesteten Anwendungen und Spielen wieder.
Spiele
Der NVIDIA GeForce RTX 3080 - 10GB liegt im Gaming Performance-Ranking 32.04% hinter dem NVIDIA GeForce RTX 5070 Ti - 16GB
NVIDIA GeForce RTX 3080 - 10GB
AVG
67.96 %
1%
73.34 %
NVIDIA GeForce RTX 5070 Ti - 16GB
AVG
100 %
1%
100 %
Raytracing
Die NVIDIA GeForce RTX 3080 - 10GB liegt im Raytracing-Ranking 38.11% hinter der NVIDIA GeForce RTX 5070 Ti - 16GB
NVIDIA GeForce RTX 3080 - 10GB
AVG
61.89 %
1%
60.83 %
NVIDIA GeForce RTX 5070 Ti - 16GB
AVG
100 %
1%
100 %
Spezifikationen
| Basis-Takt | – | 2300 MHz |
| Boost-Takt | – | 2610 MHz |
| Chip-Konfiguration | – | 70SM (8960SP/280TMU/96ROP) 70 RT-Cores 280 Tensor-Cores 48MiB L2-Cache |
Kompatibilität und Abmessungen
| Schnittstelle | – | PCIe 5.0 x16 |
| Anzahl Slots | Bitte Custom-Modell wählen | Bitte Custom-Modell wählen |
Speicher
| Speicherkapazität | – | 16 GB |
| Speichertyp | – | GDDR7 |
| Speicherinterface | – | 256 |
| Speicherbandbreite | – | 28 Gbps |
Encoding
| H.265 | ❌ | ✔️ |
| H.264 | ❌ | ✔️ |
Decoding
| AV1 | ❌ | ✔️ |
| H.265 | ❌ | ✔️ |
| H.264 | ❌ | ❌ |
| VP8 | ❌ | ✔️ |
API-Unterstützung
| DirectX | – | DirectX 12 Ultimate (12_2) |
| CUDA | – | CUDA 12.8 |
| Vulkan | – | Vulkan 1.3 |
| OpenCL | – | OpenCL 3.0 |
| OpenGL | – | OpenGL 4.6 |
| Shader Modell | – | Shader Model 6.8 |
| Multi-GPU-Unterstützung | ❌ | ❌ |
Chip-Unterstützungen
| Raytracing | ❌ | ✔️ |
| NVIDIA Tensor | ❌ | ✔️ |
| HDCP | ❌ | ✔️ |
Sonstiges
| Einführung | – | 20.02.2025 |
Spiele
Performance Rating
NVIDIA GeForce RTX 3080 - 10GB
AVG
67.96 %
1%
73.34 %
NVIDIA GeForce RTX 5070 Ti - 16GB
AVG
100 %
1%
100 %

Baldur's Gate 3
NVIDIA GeForce RTX 3080 - 10GB
AVG
72.3 FPS
1%
65.9 FPS
NVIDIA GeForce RTX 5070 Ti - 16GB
AVG
112.3 FPS
1%
88.4 FPS

Black Myth: Wukong
NVIDIA GeForce RTX 3080 - 10GB
AVG
18 FPS
1%
13.5 FPS
NVIDIA GeForce RTX 5070 Ti - 16GB
AVG
23.1 FPS
1%
18 FPS

Call of Duty: Black Ops 6
NVIDIA GeForce RTX 3080 - 10GB
AVG
41.8 FPS
1%
36.7 FPS
NVIDIA GeForce RTX 5070 Ti - 16GB
AVG
62.3 FPS
1%
51.7 FPS

Counter-Strike 2
NVIDIA GeForce RTX 3080 - 10GB
AVG
101.1 FPS
1%
71.5 FPS
NVIDIA GeForce RTX 5070 Ti - 16GB
AVG
139.8 FPS
1%
90 FPS

F1 24
NVIDIA GeForce RTX 3080 - 10GB
AVG
84.1 FPS
1%
70.3 FPS
NVIDIA GeForce RTX 5070 Ti - 16GB
AVG
125.1 FPS
1%
80.8 FPS

Ghost of Tsushima
NVIDIA GeForce RTX 3080 - 10GB
AVG
47.9 FPS
1%
42.7 FPS
NVIDIA GeForce RTX 5070 Ti - 16GB
AVG
65.4 FPS
1%
54.1 FPS
God of War Ragnarök
NVIDIA GeForce RTX 3080 - 10GB
AVG
62.9 FPS
1%
54.9 FPS
NVIDIA GeForce RTX 5070 Ti - 16GB
AVG
92.2 FPS
1%
78.1 FPS

Horizon Zero Dawn Remastered
NVIDIA GeForce RTX 3080 - 10GB
AVG
52.4 FPS
1%
48.1 FPS
NVIDIA GeForce RTX 5070 Ti - 16GB
AVG
74 FPS
1%
63.5 FPS

Satisfactory 1.0
NVIDIA GeForce RTX 3080 - 10GB
AVG
62.6 FPS
1%
41.6 FPS
NVIDIA GeForce RTX 5070 Ti - 16GB
AVG
95.1 FPS
1%
63.5 FPS

Silent Hill 2
NVIDIA GeForce RTX 3080 - 10GB
AVG
28 FPS
1%
21 FPS
NVIDIA GeForce RTX 5070 Ti - 16GB
AVG
42.2 FPS
1%
28.3 FPS

Total War: PHARAOH Dynasties
NVIDIA GeForce RTX 3080 - 10GB
AVG
88.8 FPS
1%
74.4 FPS
NVIDIA GeForce RTX 5070 Ti - 16GB
AVG
129.3 FPS
1%
107.8 FPS

Warhammer 40k: Space Marine 2
NVIDIA GeForce RTX 3080 - 10GB
AVG
43.3 FPS
1%
37.2 FPS
NVIDIA GeForce RTX 5070 Ti - 16GB
AVG
73.9 FPS
1%
63.6 FPS
Spiele RT
Performance Rating
NVIDIA GeForce RTX 3080 - 10GB
AVG
61.89 %
1%
60.83 %
NVIDIA GeForce RTX 5070 Ti - 16GB
AVG
100 %
1%
100 %

Alan Wake 2: Haus am See
NVIDIA GeForce RTX 3080 - 10GB
AVG
10.5 FPS
1%
5.5 FPS
NVIDIA GeForce RTX 5070 Ti - 16GB
AVG
33.4 FPS
1%
27.7 FPS

Black Myth: Wukong
NVIDIA GeForce RTX 3080 - 10GB
AVG
6.3 FPS
1%
5.2 FPS
NVIDIA GeForce RTX 5070 Ti - 16GB
AVG
11.6 FPS
1%
9.7 FPS

Cyberpunk 2077: Phantom Liberty
NVIDIA GeForce RTX 3080 - 10GB
AVG
11.6 FPS
1%
8 FPS
NVIDIA GeForce RTX 5070 Ti - 16GB
AVG
28 FPS
1%
24 FPS

Dying Light 2 Stay Human
NVIDIA GeForce RTX 3080 - 10GB
AVG
24.9 FPS
1%
21.3 FPS
NVIDIA GeForce RTX 5070 Ti - 16GB
AVG
38.3 FPS
1%
33.3 FPS

Ghostwire: Tokyo
NVIDIA GeForce RTX 3080 - 10GB
AVG
33.9 FPS
1%
18.6 FPS
NVIDIA GeForce RTX 5070 Ti - 16GB
AVG
53.4 FPS
1%
30.6 FPS

Indiana Jones und der Große Kreis
NVIDIA GeForce RTX 3080 - 10GB
AVG
55.9 FPS
1%
49.4 FPS
NVIDIA GeForce RTX 5070 Ti - 16GB
AVG
82.7 FPS
1%
72.4 FPS

Metro Exodus Enhanced Edition
NVIDIA GeForce RTX 3080 - 10GB
AVG
40.1 FPS
1%
33.5 FPS
NVIDIA GeForce RTX 5070 Ti - 16GB
AVG
59.8 FPS
1%
47.9 FPS

The Witcher 3: Wild Hunt
NVIDIA GeForce RTX 3080 - 10GB
AVG
28.6 FPS
1%
23.6 FPS
NVIDIA GeForce RTX 5070 Ti - 16GB
AVG
35 FPS
1%
25.8 FPS
Anwendungen
Für das Jahr 2025 gibt es keine gemeinsamen Anwendungs-Tests der beiden Produkte.
 Die Produktdaten, Händler-, Angebotsdaten und Bewertungen werden freundlicherweise von Geizhals.de bereitgestellt.